Institutional Insights: BofA Systematic Flows Monitor 'CTA Selling Still Spans Equities & Bonds'

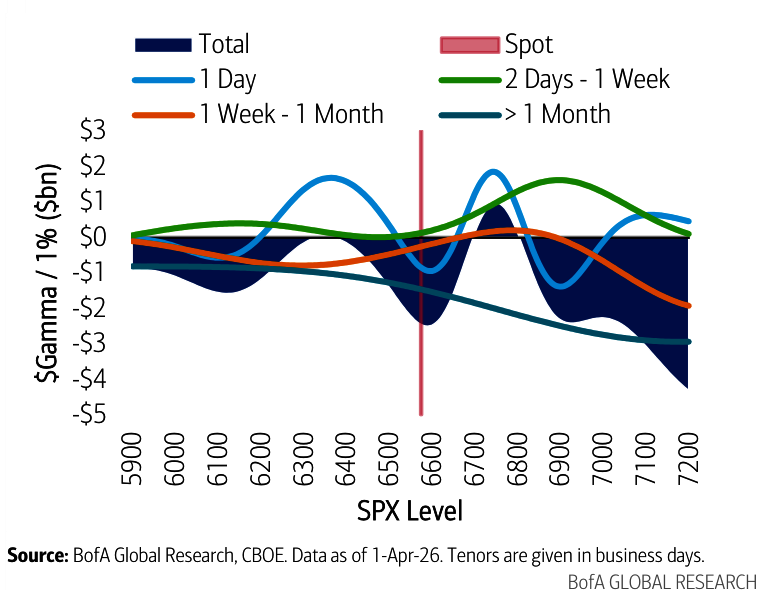
SPX Gamma Short Position: The market is currently facing a significant net short position of $3.9 billion in SPX gamma, with $3.5 billion in non-expiring options and $200 million in ODTs. This scenario is likely to amplify volatility during intraday hedging activities.
Delta-Hedging Volatility Surge: Between 15:45 and 16:00, delta-hedging activities have been known to cause a remarkable spike in S&P 500 e-mini realised volatility, surging by 1.3 points or 8% on a monthly basis.
Systematic Equity Flow Trends: In down markets, there's been a notable aggressive selling trend amounting to $51 billion, compared to just $33 billion in buying during market upswings. This bearish flow bias is crucial for understanding current market positioning.
Defensive Positioning Insights: Current systematic global equity positioning is below the five-year median, which limits potential upside in rising market conditions.
SPX Gamma Concentration Risks: Significant gamma spikes are expected around key expiry dates (e.g., April 10 and April 24), increasing the risk of market impact.
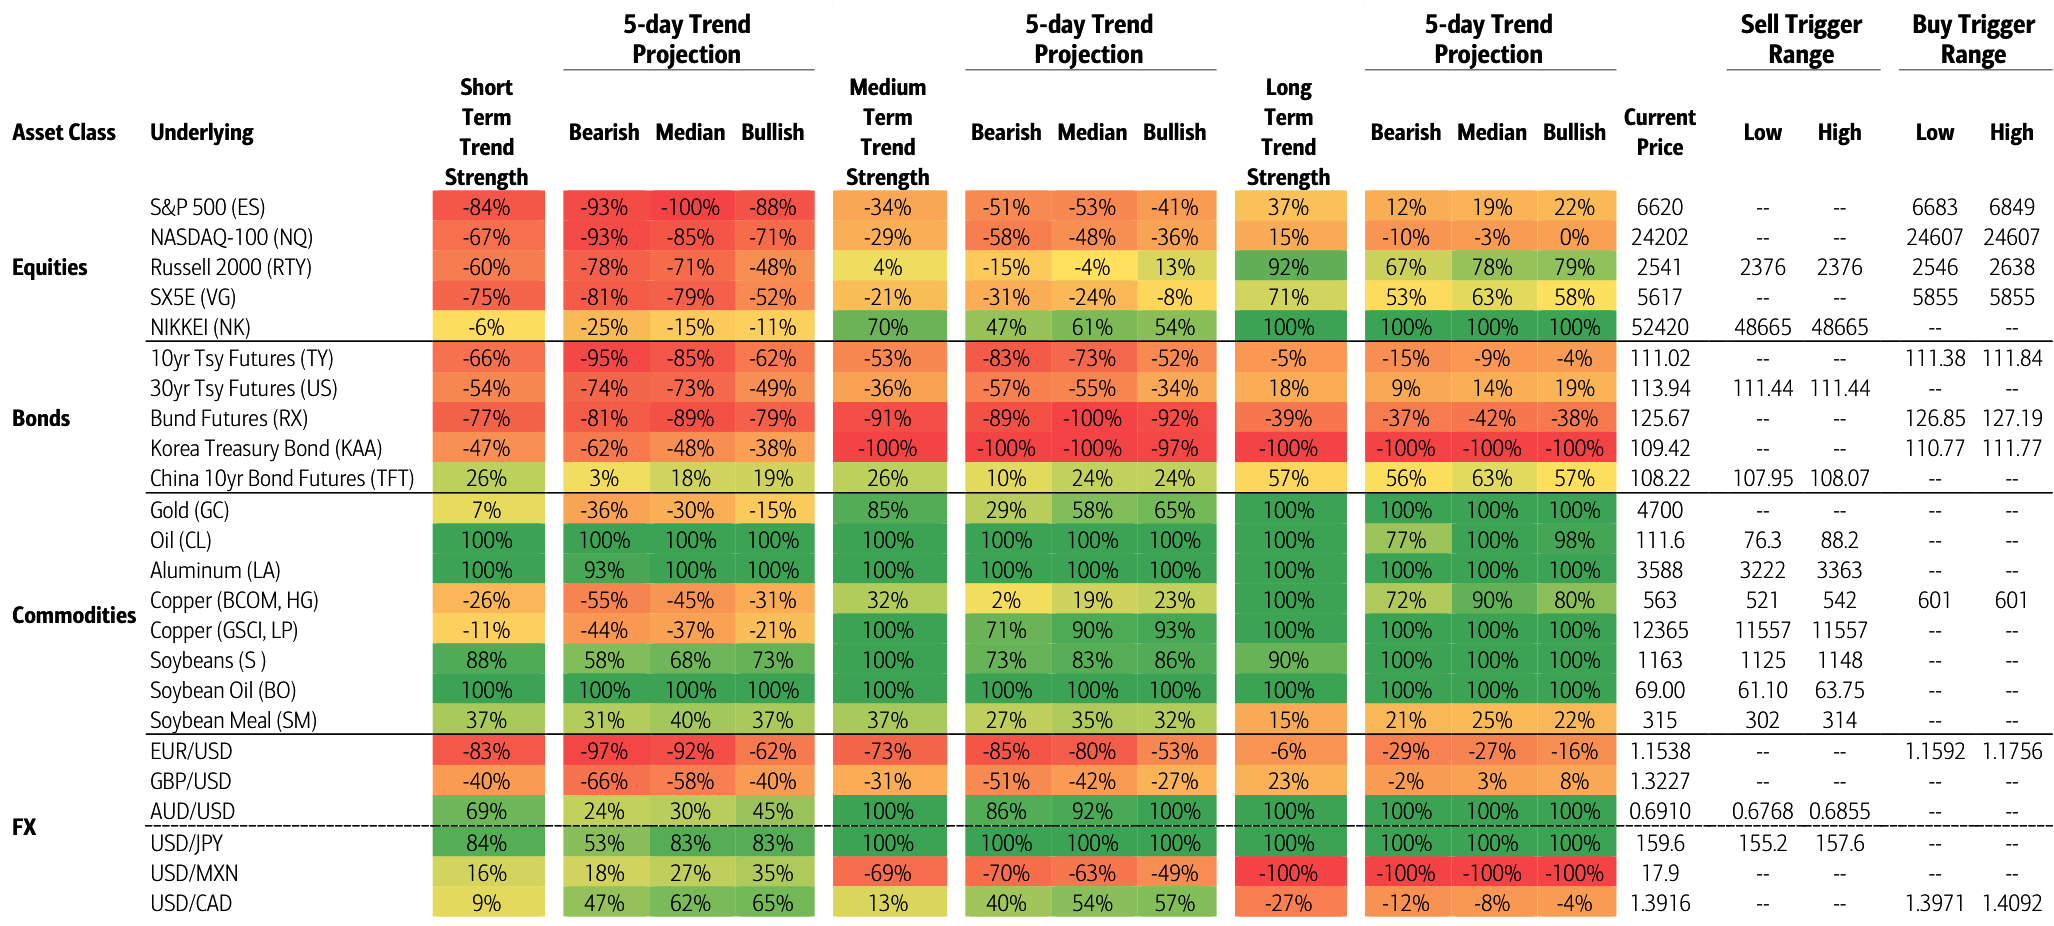
S&P 500 Trend Analysis: Short-term indicators are signaling a bearish outlook at -93%, with medium-term also leaning bearish at -51%. However, long-term trends show a bullish sentiment at +22%, with a buy trigger identified at 6683.
UST Short Position Intensification: Trend followers are increasing their short positions in UST (front curve), while USD buying remains strong despite a slight dip in value.
Gold's Strong Performance Signal: Gold is exhibiting a robust bullish trend across all time frames, contrasting sharply with the bearish outlook for 10-year Treasuries in both the short and medium terms (-54%/-74%).
CTA Stop-Out Levels: The USD/MXN currency pair is seeing the highest stop-out levels among models, with both USD/MXN and CAD surpassing the stress threshold of four models.
Critical Unwind Indicators: Key unwind levels to watch include SPX at 6683 (buy) and 6849 (sell), soybean meal at 1,150, and USD/MXN between 17.33 and 18.01.
FX Volatility Trends: The EUR/USD pair is showing extreme short-term bearishness at -93%, while AUD/USD is bullish at +69%. Conversely, USD/MXN is reflecting a bearish sentiment at -70%.
ETF Liquidity Dynamics: Leveraged and inverse ETFs in the US are significantly impacting trading volumes, with $861 million for S&P 500 and $2 billion for NASDAQ-100 per 1% index movement.
NVDA ETF Influence: NVIDIA dominates with $5.198 billion in assets under management (AUM) within leveraged and inverse ETFs, experiencing a rebalance of $114.2 million for every 1% price change.
TSLA/NVDA Flow Adjustments: There has been a notable shift in ETF rebalance volumes, with TSLA decreasing from $114 million to $8 million and NVDA increasing from $124 million to $6 million.
Commodity Market Divergence: While gold remains bullish, copper (HGT) is showing bearish trends at -26% in the short term, with long unwinding near the 11,100 mark.
Fixed Income Unwinding Risks: Long positions in 10-year Treasuries (TY) are peaking just before December 23, indicating a potential unwind near the 107-113 range.
Soybean Meal Upside Potential: There’s a growing interest in long positions for soybean meal, but caution is advised as unwind risks loom near the 1,150 level.
Copper Unwind Triggers: Watch for potential long unwinding in copper (HG) around the 547 level as it approaches its median point.
USD/MXN Market Fundamentals: This currency pair is heavily influenced by oil prices and US-Mexico relations, posing a high risk of stop-outs.
NASDAQ-100 ETF Scale Insights: The AUM for NASDAQ-100 leveraged and inverse ETFs stands at approximately $38 billion, significantly outpacing the S&P 500’s $18 billion.
Single-Stock Amplification Effects: The combined AUM for Tesla and NVIDIA ETFs ($5.1 billion and $5.2 billion respectively) is amplifying index movements through their rebalancing activities.
China Bond Unwind Concerns: The strong long positioning in China’s 10-year bond futures suggests an impending bearish unwind as triggers loom closer.
Cross-Asset Divergence Observations: There’s a noticeable bearish momentum in US Treasuries and Bunds compared to Korean bonds (KTB), which are expected to maintain their long bias until late February.
Disclaimer: The material provided is for information purposes only and should not be considered as investment advice. The views, information, or opinions expressed in the text belong solely to the author, and not to the author’s employer, organization, committee or other group or individual or company.
Past performance is not indicative of future results.
High Risk Warning: CFDs are complex instruments and come with a high risk of losing money rapidly due to leverage. 69% and 73% of retail investor accounts lose money when trading CFDs with Tickmill UK Ltd and Tickmill Europe Ltd respectively. You should consider whether you understand how CFDs work and whether you can afford to take the high risk of losing your money.
Futures and Options: Trading futures and options on margin carries a high degree of risk and may result in losses exceeding your initial investment. These products are not suitable for all investors. Ensure you fully understand the risks and take appropriate care to manage your risk.
Patrick has been involved in the financial markets for well over a decade as a self-educated professional trader and money manager. Flitting between the roles of market commentator, analyst and mentor, Patrick has improved the technical skills and psychological stance of literally hundreds of traders – coaching them to become savvy market operators!