Institutional Insights: Deutsche Bank Investor Flows & Positioning Update 8/6/25

Rotation On Cue: Choppier Grind Higher, Less Mega-Cap Tech Leadership
The latest positioning and flows framework argues that the market is behaving largely as expected: the setup favored a slower, choppier grind higher with rotation away from Mega-Cap Growth and Tech and into sectors, styles, and regions that had lagged. Friday’s sharp selloff in Tech and AI-related winners was not necessarily a rejection of the broader bull case. Rather, it was a forceful reminder that rotations are rarely smooth. The November-to-February rotation was unusually clean; most rotations involve drawdowns, factor shocks, and abrupt leadership changes.
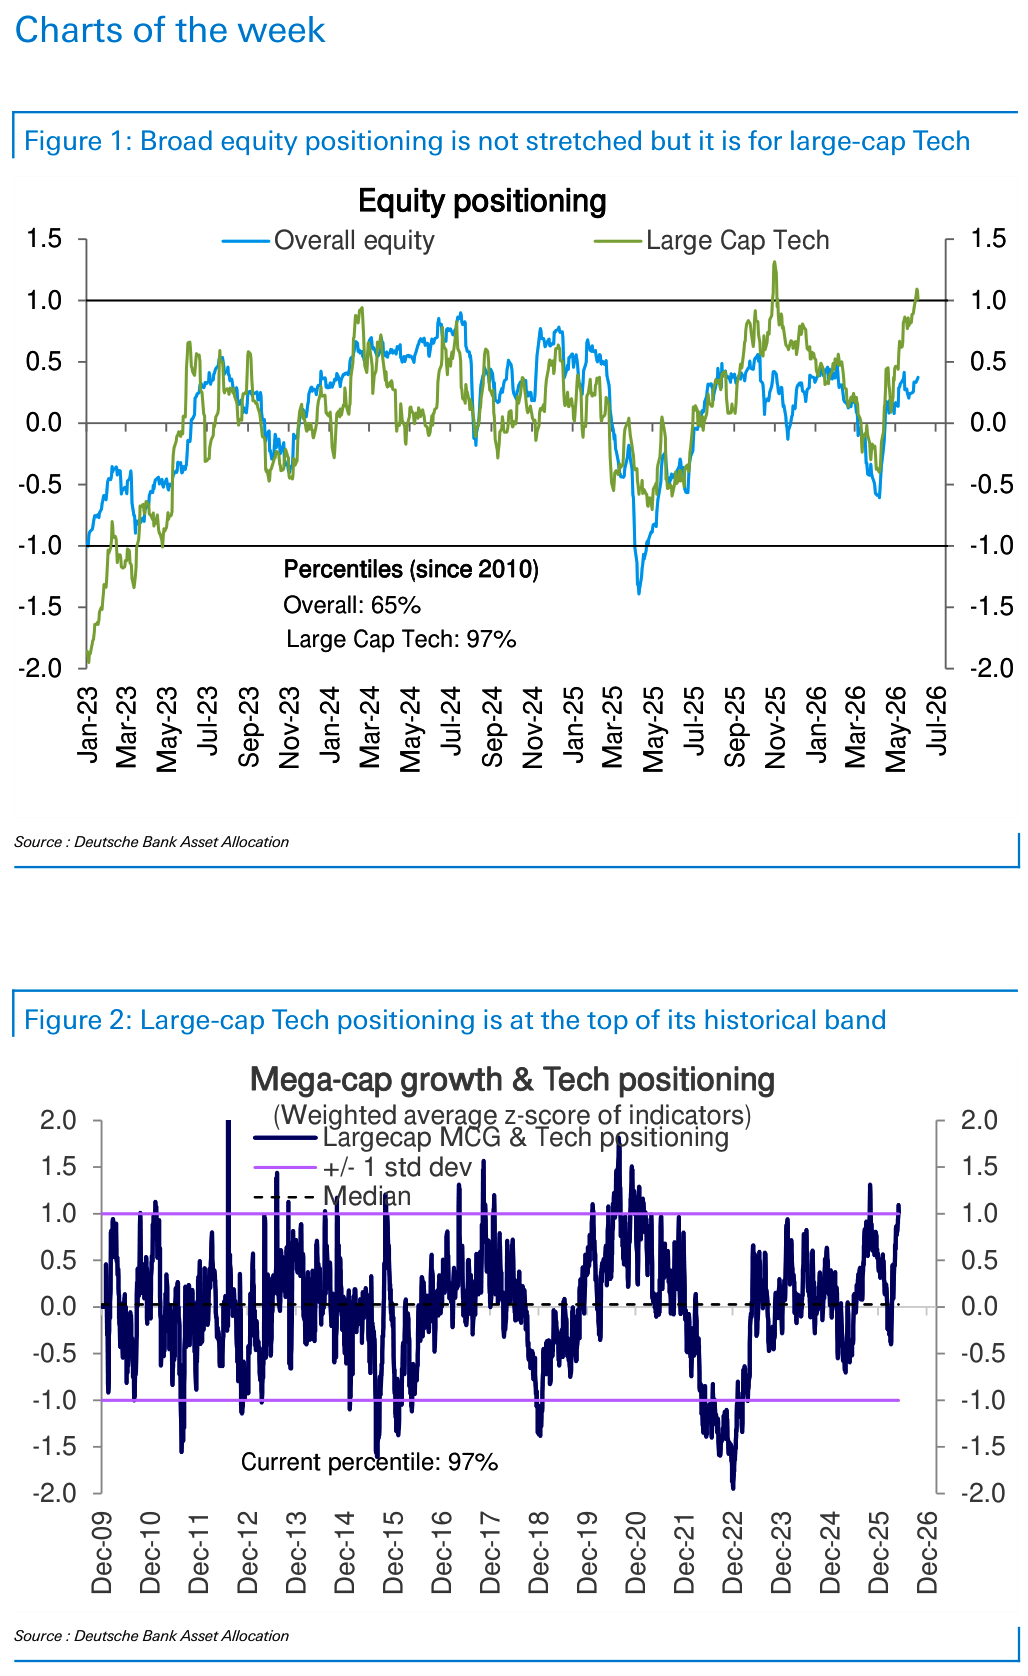
The key point is that overall equity positioning is not stretched, but large-cap Tech positioning is extremely stretched. Total equity positioning is around the 66th percentile, which is above average but not excessive. By contrast, large-cap Tech positioning is at the 97th percentile, leaving the group vulnerable to any combination of higher rates, rising rates volatility, earnings-bar disappointment, issuance supply, or AI narrative fatigue. This helps explain why Friday’s selloff was concentrated in AI, Semis, momentum, 12-month winners, non-profitable Tech, drones, space, quantum, and crypto-sensitive names, while S&P ex-AI finished roughly unchanged.
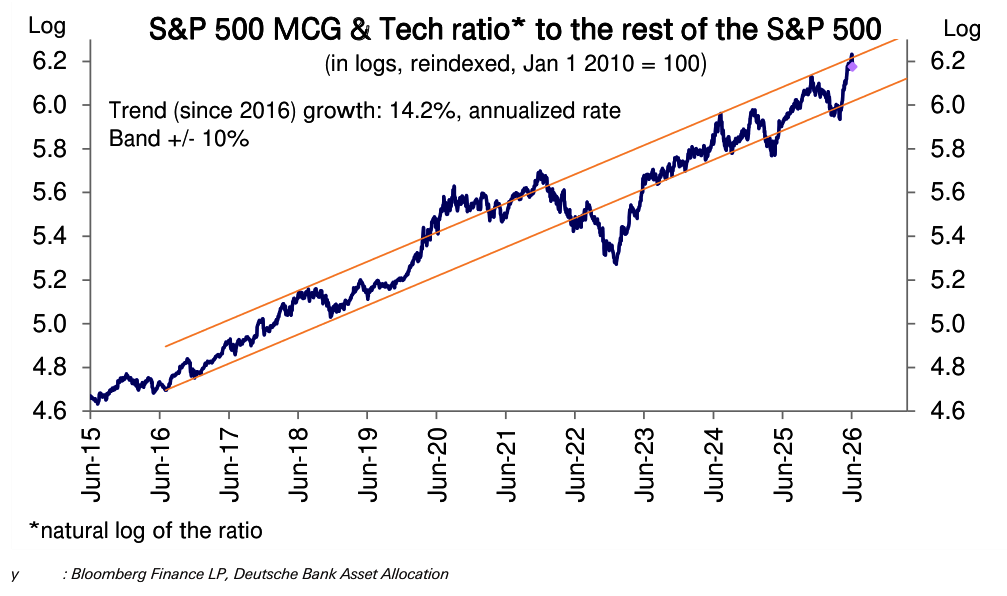
Mega-Cap Growth and Tech outperformance had also been near the top of its decade-long trend channel. That matters technically and cyclically. Over the past decade, MCG and Tech have repeatedly pushed toward the upper end of their relative-performance channel, then mean-reverted back into it. The recent selloff pulled relative performance back down into the channel. This resembles prior episodes, including late October last year and late 2024. In that sense, the move is less a regime break and more a familiar correction from an overextended relative-performance extreme.
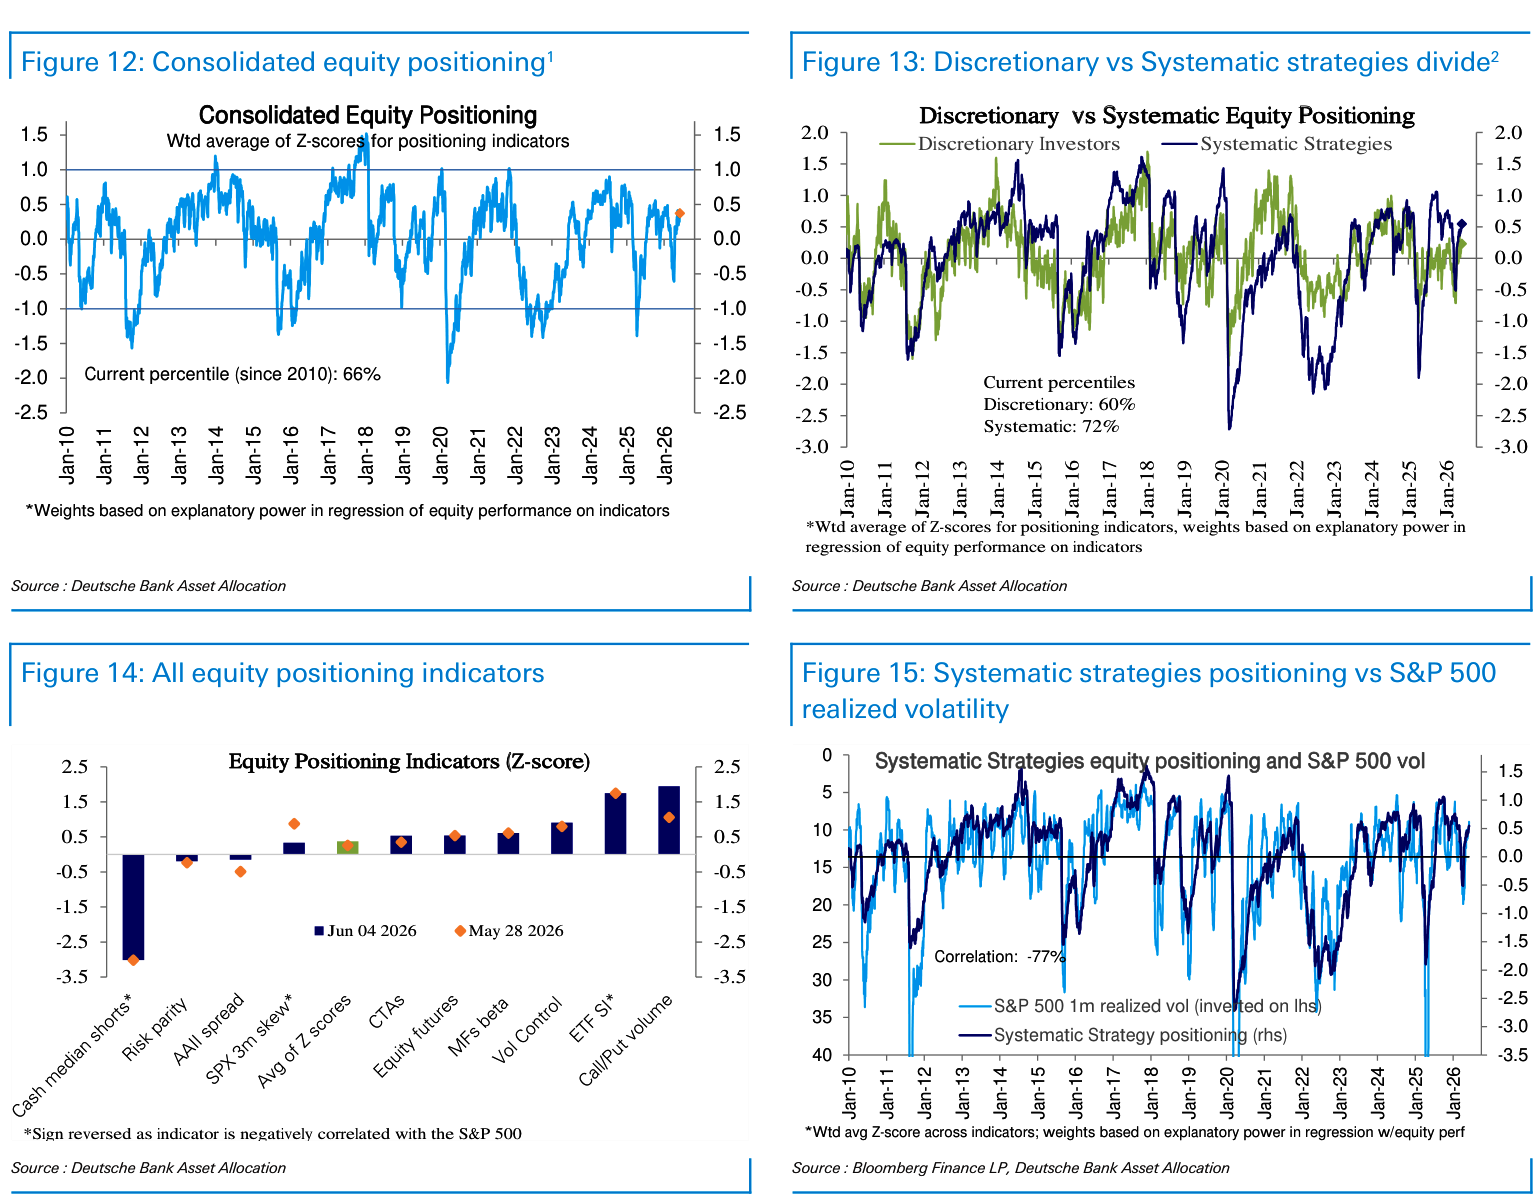
The rotation argument is strengthened by the fact that discretionary positioning has room to rise. Overall discretionary equity positioning is around the 60th percentile, only modestly overweight. That is not especially aggressive given the improvement in macro data, earnings growth, and earnings revisions. If the macro cycle continues to improve and earnings upgrades broaden, investors have room to add equity exposure outside the most crowded Tech complex. This is the foundation for the “choppier grind higher” view: not a broad de-risking, but a broadening of leadership.
Macro data surprises have picked up strongly. Payrolls and ISM have helped ease fears of a growth slowdown, and popular data surprise indices are now approaching the top of their historical band at roughly the 91st percentile. Yet discretionary positioning has not caught up to that improvement. With ISM at 54, it is still only around the middle of its usual range of 45 to 60, and a typical upcycle could see it rise further. This suggests that investors may still be under-positioned for a genuine cyclical improvement, especially outside the already-loved Tech leadership.
Earnings growth supports the broadening case. S&P 500 earnings growth surged to 25% in Q1, led by large-cap Tech at 44%. But the important detail is that earnings growth outside Mega-Cap Growth and Tech was also strong. Excluding MCG and Tech, earnings growth jumped to 14%, which is near the top of the historical band outside recession recoveries. Median company earnings growth also rose sharply to 12.5%, arguably the strongest in two decades. That means the market’s earnings story is no longer solely an AI/Mega-Cap Tech story, even if Tech remains the most powerful contributor.
This is important because discretionary positioning is still consistent with only mid-to-high-single-digit earnings growth. If actual earnings growth outside Tech is running in the low-to-mid teens, there is room for non-Tech sectors to attract capital. That helps explain recent demand for Financials, Health Care, MedTech, Pharma, Managed Care, Industrials, select Consumer services, and REITs, even during a week when the headline index move looked risk-off because of the Tech drawdown.
The breadth of earnings upgrades is also near the top of its historical range. Forward consensus estimate upgrades have clearly been led by large-cap Tech, but the breadth of revisions is strong more broadly. Again, discretionary positioning appears to lag this improvement, with positioning still more consistent with revision breadth near zero. If upgrade breadth remains strong, laggard sectors can continue to benefit as investors are forced to acknowledge that earnings acceleration is not confined to AI and Mega-Cap Growth.
Systematic strategies are also supportive, though not without risk. Systematic equity positioning is around the 72nd percentile and continues to grind higher as trend signals remain strong and volatility edges lower. The fading of the war shock from lookback windows also mechanically supports higher systematic exposure. This can provide a steady bid to equities as long as realized volatility remains contained and trend signals stay positive. However, it also means a sharp volatility shock, especially one triggered by rates volatility or geopolitical headlines, could slow or reverse systematic demand.
The note emphasizes that equities are increasingly reacting to rising rates volatility, not simply the absolute level of rates. Strong growth and inflation data have pushed rates volatility higher, especially in the context of uncertainty around a new Fed chair. The correlation between the S&P 500 and rates has reached record negative extremes. In plain English, equities are becoming very sensitive to higher yields. But the historical lesson from the last several years is more nuanced: equities tend to sell off when rates volatility rises, but they often recover once rates volatility subsides, even if the level of rates remains elevated.
That distinction matters after the hot NFP print. The immediate market reaction was to price close to one hike through year-end and push the 10-year back through 4.5%, pressuring high-duration Tech and crowded momentum. But if rates volatility stabilizes and yields stop moving disorderly higher, equities can recover even with rates still elevated. This suggests the bigger risk for equities is not simply “4.5% to 4.9% 10-year yields,” but a continuation of abrupt, unstable moves in the rates market.
The flows picture remains constructive at the aggregate level. Equity funds saw inflows rise to a six-week high, driven entirely by US funds at $20.7bn and broad-global funds at $16.6bn. This reinforces the idea that global investors are still allocating to US equities and broad global equity exposure. However, regional flows remain uneven. Funds dedicated to other regions continued to see strong outflows, including broad EM at -$3.0bn and Europe at -$1.0bn, along with other regional outflows. The market’s confidence is still concentrated in the US and broad global vehicles rather than region-specific non-US exposure.
Bond funds also saw record inflows of $39bn, with nearly every category attracting strong demand. This cross-asset inflow boom is important. Investors are not abandoning risk assets; they are allocating to both equities and bonds. That may reflect strong household wealth effects, high cash balances being deployed, improved confidence in growth, and attractive yields in fixed income. It also helps explain why equity issuance has been so heavy: companies are responding to strong demand for financial assets, consistent with academic literature and prior empirical patterns.
The heavy issuance point matters for current market structure. A wave of equity issuance is not automatically bearish if it reflects strong demand. But issuance can create temporary pressure on the most liquid funding sources, particularly Mega-Cap Tech and Semi winners. Recent megacap supply, the GOOGL offering, expected future issuance, and the looming SpaceX IPO all fit this framework. The market may have the liquidity to absorb supply, but the absorption process can create rotations, factor shocks, and selling in crowded winners.
The main conclusion is that Friday’s selloff does not invalidate the equity bull case. It supports the rotation thesis. Overall equity positioning is not stretched, macro surprises are strong, earnings growth is broadening, revision breadth is near the top of the range, and cross-asset inflows remain robust. The problem is that Mega-Cap Growth and Tech were priced and positioned for perfection, with relative outperformance near the top of a decade-long channel and positioning at the 97th percentile. That made them vulnerable to the exact combination of catalysts that arrived: hot payrolls, higher rates volatility, AVGO disappointment versus a high bar, AI narrative uncertainty, and issuance concerns.
The practical takeaway is to remain constructive on equities but more selective on leadership. The market can continue to grind higher, but the path should be slower and choppier, with less dependence on Mega-Cap Tech and more participation from laggards. If rates volatility calms, the drawdown in Tech can stabilize, but the better risk/reward may increasingly sit in sectors where positioning is lighter and earnings revisions are improving: Financials, Health Care, Industrials, select Consumer services, Real Estate, and non-Tech cyclicals. The biggest risk to this view is a renewed spike in rates volatility or a liquidity shock from heavy issuance, especially if it forces additional selling in already crowded Tech and AI winners.
Disclaimer: The material provided is for information purposes only and should not be considered as investment advice. The views, information, or opinions expressed in the text belong solely to the author, and not to the author’s employer, organization, committee or other group or individual or company.
Past performance is not indicative of future results.
High Risk Warning: CFDs are complex instruments and come with a high risk of losing money rapidly due to leverage. 69% and 73% of retail investor accounts lose money when trading CFDs with Tickmill UK Ltd and Tickmill Europe Ltd respectively. You should consider whether you understand how CFDs work and whether you can afford to take the high risk of losing your money.
Futures and Options: Trading futures and options on margin carries a high degree of risk and may result in losses exceeding your initial investment. These products are not suitable for all investors. Ensure you fully understand the risks and take appropriate care to manage your risk.
Patrick has been involved in the financial markets for well over a decade as a self-educated professional trader and money manager. Flitting between the roles of market commentator, analyst and mentor, Patrick has improved the technical skills and psychological stance of literally hundreds of traders – coaching them to become savvy market operators!