Institutional Insights: Goldman Sachs Flow OF Funds 'Ebb & Flows'

The big flow pillars (what’s supportive vs what can break)
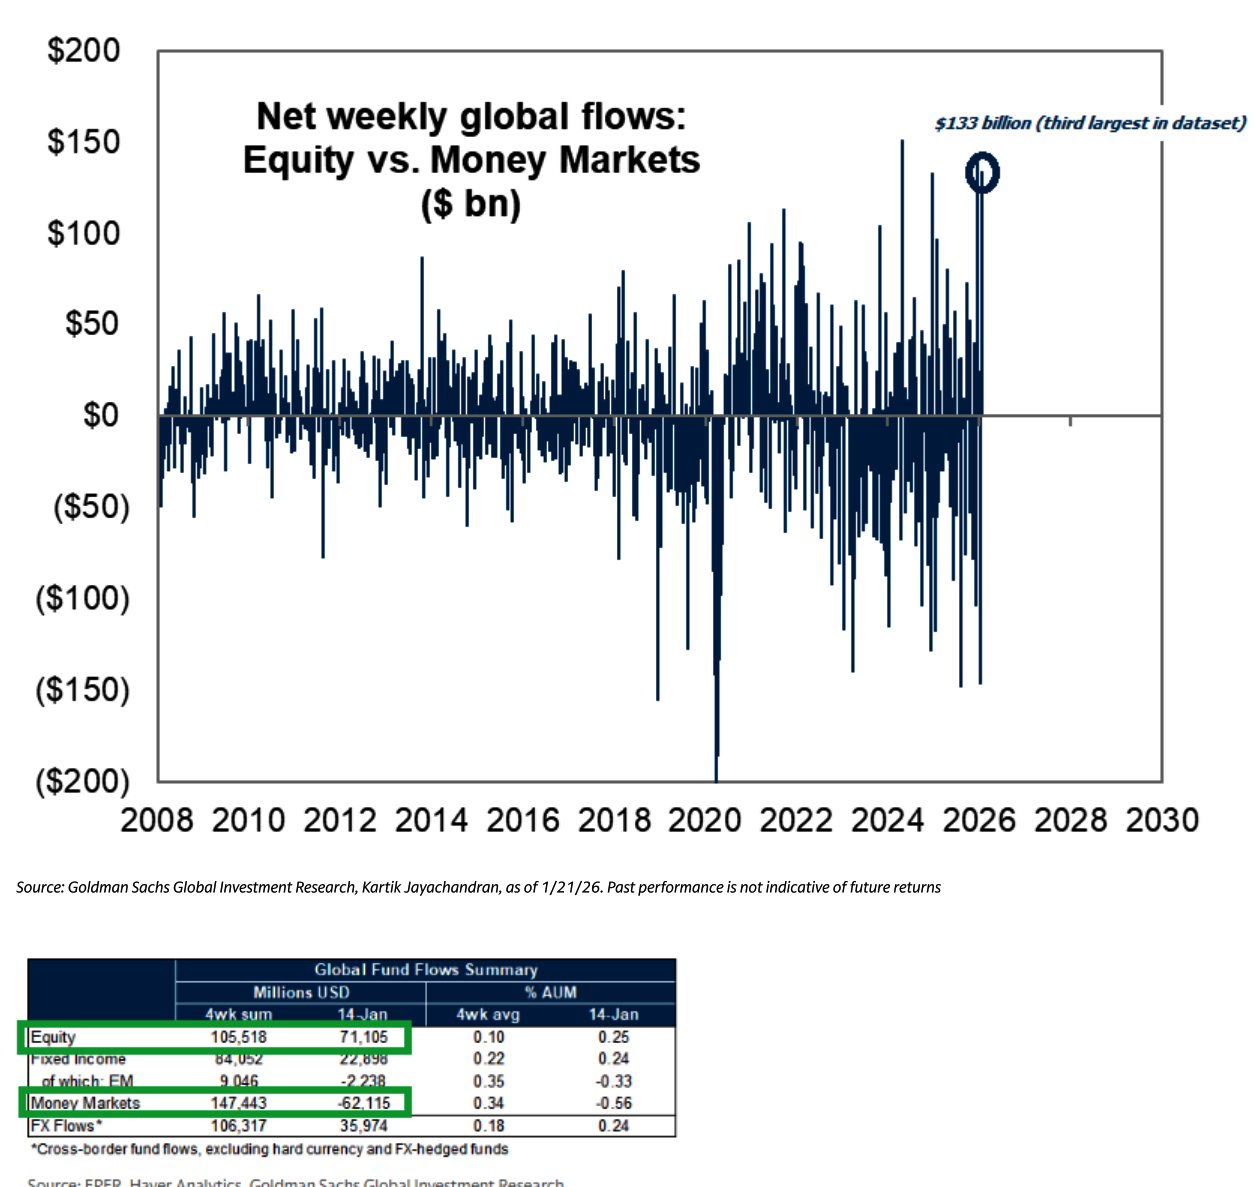
### 1) Fund flows: equities in, cash out
- Huge equity fund inflows led by US + EM: +$71bn vs +$2bn prior week (their emphasis: massive acceleration).
- Money market assets fell -$62bn, cited as 3rd largest in their dataset → cash is rotating out of sidelines.
- Sector leadership in flows: commodities, tech, financials; over 4 weeks: commodities + industrials notably strong.
**The “cash on the sidelines” trope is becoming real in their data—supportive for dips, especially if dealers/buybacks step in.
---
### 2) “Sentiment” vs sentiment (a subtle but important nuance)
- GS “Sentiment Indicator” is positioning in US equities, not feelings.
- Latest read -0.2 implies investors are still somewhat skittish / not fully loaded, even as AAII sentiment is at a 1-year high.
**divergence: people say they’re bullish (survey), but positioning is not maxed (their measure). They expect this gap to collapse—which could happen via:
- positioning catching up (rally continuation), or
- sentiment cracking (headline shock / vol spike).
--
### 3) Prime brokerage flows: indices/ETFs shorted, single stocks bought
- Macro products (index + ETF): biggest net selling in 4 weeks (**-1.1 SD**), entirely via short sales.
- US-listed ETF shorts down -1.1% WoW, but still +8.1% MoM; driven by covering in large-cap equity ETFs.
- Single stocks: slight net buy (**+0.2 SD**), with long buys > short sales (1.2:1).
**fits the “broadening” / stock-picker market theme: less pure index beta chasing, more micro-level selection.
---
### 4) Funding spreads: leverage demand is returning
- Funding spreads bounced off lows → aligns with re-leveraging in systematic community.
**When leverage conditions ease, systematic players can add risk faster—until vol changes that.
---
### 5) Systematics: the “cliff risk” is on down tapes
- Since start of year: systematics added ~$5B US equity exposure (low realized vol helped).
- Recent price action pushed CTAs to moderate sellers, but they’re close to thresholds (so regime can flip quickly).
- Their projected flows are very asymmetric:
- 1 week: flat = -$6.7B sellers; up = +$1.8B buyers; down = -$44.6B sellers
- 1 month: flat = -$15.9B; up = +$14.8B; down = -$210B sellers
**Upside adds are modest, but downside de-risking is large. That’s the mechanical reason they’re wary of “headline shock → outsized move.”
---
### 6) Options gamma: calming force after a bounce
- Post selloff: dealer gamma “cleaner.”
- Dealers become max long S&P gamma about +3% from here → a rally can push the market back into a gamma pocket (i.e., dealer hedging dampens volatility).
**Near term could feel choppy until price moves into that “positive gamma cushion,” after which intraday moves tend to compress.
---
### 7) Dispersion: index hedges rich vs single names (stock-picker regime)
- SPX skew vs constituents: 93rd percentile (1y) / 97th (4y).
- Single-stock 1m IV vs index: 89th (1y) / 97th (5y).
**Investors are paying up for index protection relative to single names, and/or single-name upside is being chased. This is consistent with “less explosive index rallies, more differentiated winners/losers.”
---
### 8) Buybacks: blackout ending = incremental bid
- Final week of blackout.
- They expect supportive buyback flows starting next week as windows reopen.
**This is one of the most reliable “calendar tailwinds” for US equities—especially for dip support.
---
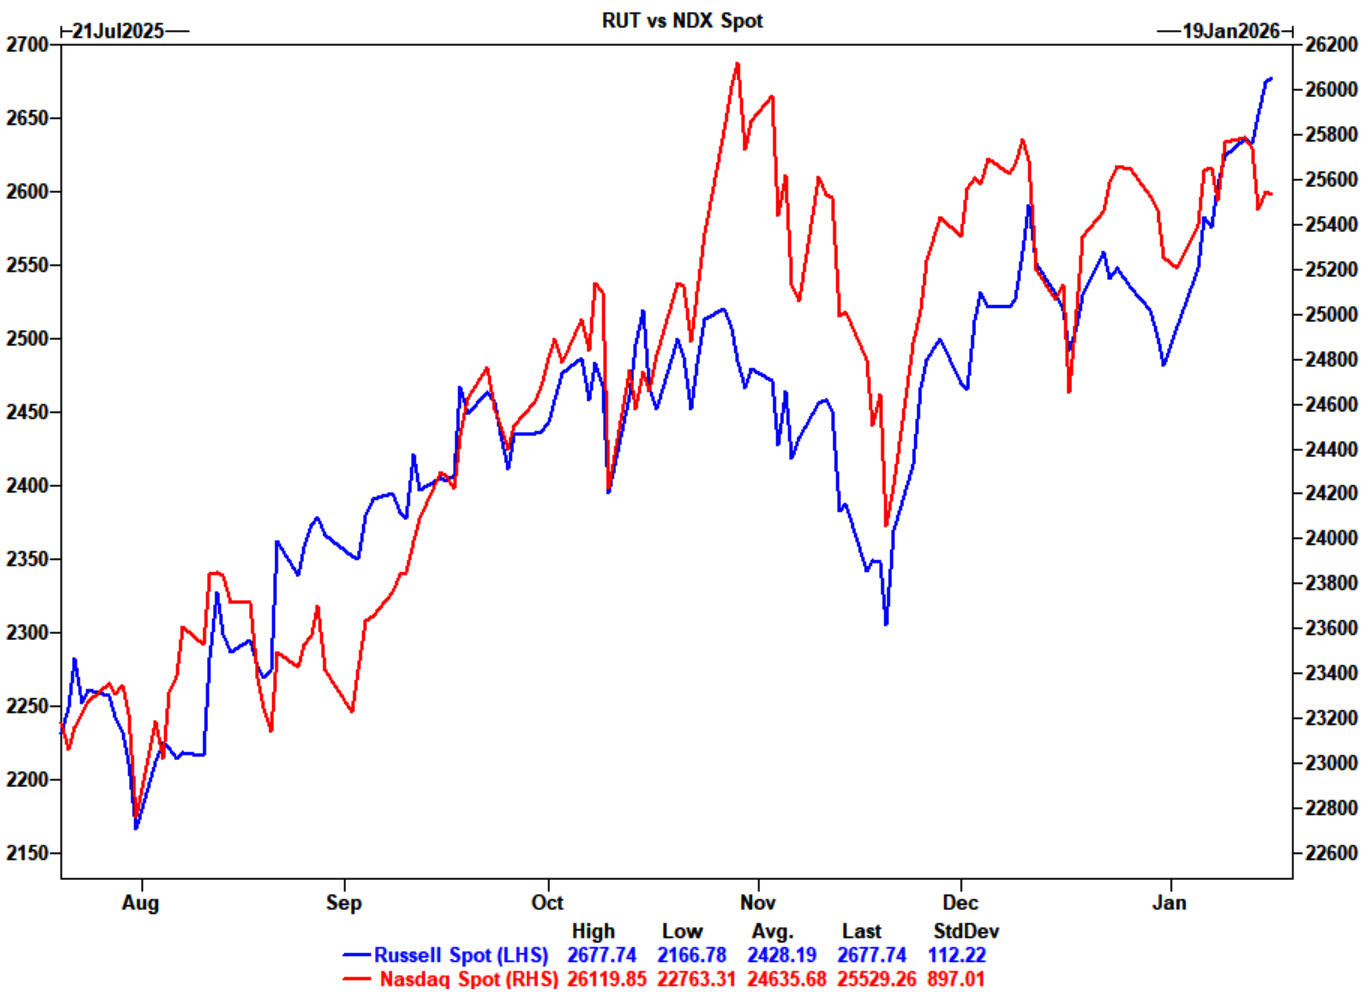
### 9) RTY vs NDX: early-year small-cap burst, history mixed
- RTY has outperformed NDX by ~3% YTD; RTY outperformed SPX every day in 2026 so far (fun stat).
- Historically (8 prior cases since 1928 where RTY beat NDX by >2% early):
- Avg next 1w: NDX -1.18%, RTY -0.21% (soft)
- Avg next 1m: NDX +1.96%, RTY +3.59% (RTY tends to hold up)
- Avg next 1y: NDX +10.25%, RTY +7.11% (NDX edges longer-run average)
**Early RTY leadership doesn’t guarantee a straight line; short-term can wobble, 1-month favors RTY on average, 1-year tilts back toward NDX.
---
****what “contained selloffs + relief rallies” means in practice
“The tape is supported by flows, but it’s brittle—selloffs may get bought, yet shocks can still cause violent downdrafts because systematic selling is convex.”- Expect choppiness with fast reversals: selloff → stabilizes → relief rally → calmer (if gamma turns supportive).
- Downside is the bigger risk than upside surprise because systematic selling is much larger on down tapes than buying on up tapes.
- Stock selection matters more than index beta in this regime (dispersion high, index hedges rich).
- Calendar matters: buyback windows reopening is a tangible near-term bid.
Disclaimer: The material provided is for information purposes only and should not be considered as investment advice. The views, information, or opinions expressed in the text belong solely to the author, and not to the author’s employer, organization, committee or other group or individual or company.
Past performance is not indicative of future results.
High Risk Warning: CFDs are complex instruments and come with a high risk of losing money rapidly due to leverage. 69% and 73% of retail investor accounts lose money when trading CFDs with Tickmill UK Ltd and Tickmill Europe Ltd respectively. You should consider whether you understand how CFDs work and whether you can afford to take the high risk of losing your money.
Futures and Options: Trading futures and options on margin carries a high degree of risk and may result in losses exceeding your initial investment. These products are not suitable for all investors. Ensure you fully understand the risks and take appropriate care to manage your risk.
Patrick has been involved in the financial markets for well over a decade as a self-educated professional trader and money manager. Flitting between the roles of market commentator, analyst and mentor, Patrick has improved the technical skills and psychological stance of literally hundreds of traders – coaching them to become savvy market operators!