Institutional FX Insights: Pictet DXY Techs

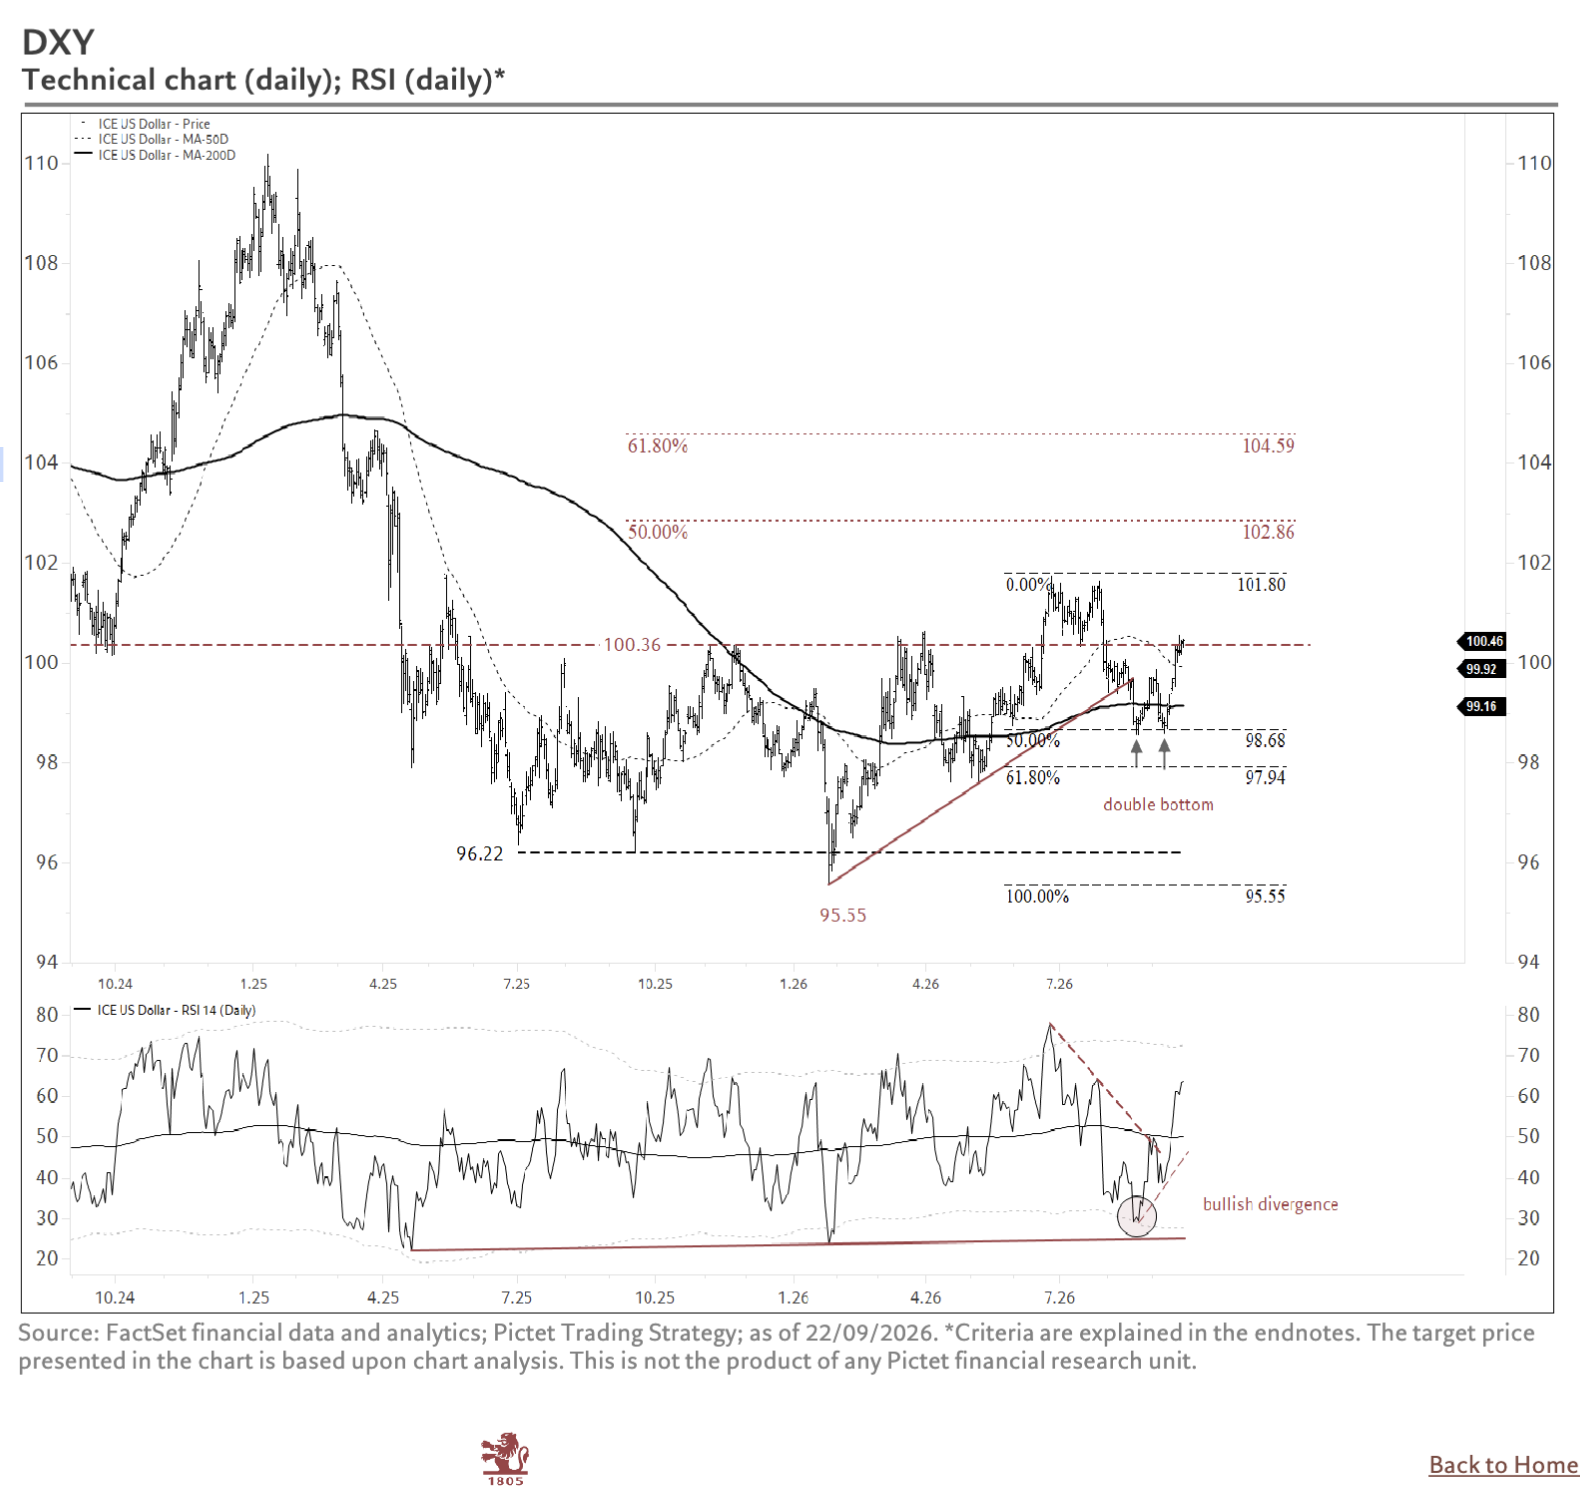
GLOBAL MACRO & FX TECHNICAL BRIEFING: US DOLLAR INDEX (DXY)
Theme: Short-Term Double-Bottom Breakout & Reversal Dynamics
THE TAKE: TECHNICAL BREAKOUT VALIDATES SHORT-TERM DXY RECOVERY
The US Dollar Index (DXY) has completed a short-term double-bottom breakout above 100.36 after successfully holding key structural support at 98.68. Trading around 100.46, DXY is maintaining position above both its 50-day Simple Moving Average (SMA) near 99.92 and 200-day SMA at 99.16, signaling a material improvement in its short-term trend structure.
A validated daily RSI bullish divergence (RSI ~62) corroborates the breakout, indicating strengthening upside momentum with remaining runway before entering overbought territory. A sustained daily close above 100.36 confirms the pattern and opens technical scope toward 101.80.
TECHNICAL LEVELS & PATTERN OBJECTIVES
Upside Targets & Resistance Matrix:
Pattern Target: 101.80 (Measured move objective from double-bottom base)
Fibonacci Retracement 1: 102.86
Fibonacci Retracements 2: 104.59
Downside Support & Invalidated Triggers:
Initial Support Cluster: 100.36 (Former resistance turned support)
Secondary Support: 99.92 (50-day SMA)
Key Trend Pivot: 99.16 – 98.68 (200-day SMA and critical swing support)
Invalidation Level: 97.94 (A break below invalidates double-bottom structure and opens downside toward 95.55)
CROSS-ASSET & FX DESK IMPLICATIONS
Dollar Impulse: The technical breakout supports recent desk views of a recovering USD off range lows, providing near-term headwinds for non-USD G10 majors (EUR/USD, GBP/USD) and non-yielding assets.
Tactical Risk Management: Technical traders should monitor the 100.36–99.92 support cluster closely; a hold above this level keeps the bias tilted toward the 101.80 pattern objective, whereas a drop back below 99.92 weakens the breakout narrative.
Disclaimer: The material provided is for information purposes only and should not be considered as investment advice. The views, information, or opinions expressed in the text belong solely to the author, and not to the author’s employer, organization, committee or other group or individual or company.
Past performance is not indicative of future results.
High Risk Warning: CFDs are complex instruments and come with a high risk of losing money rapidly due to leverage. 69% and 73% of retail investor accounts lose money when trading CFDs with Tickmill UK Ltd and Tickmill Europe Ltd respectively. You should consider whether you understand how CFDs work and whether you can afford to take the high risk of losing your money.
Futures and Options: Trading futures and options on margin carries a high degree of risk and may result in losses exceeding your initial investment. These products are not suitable for all investors. Ensure you fully understand the risks and take appropriate care to manage your risk.
Patrick has been involved in the financial markets for well over a decade as a self-educated professional trader and money manager. Flitting between the roles of market commentator, analyst and mentor, Patrick has improved the technical skills and psychological stance of literally hundreds of traders – coaching them to become savvy market operators!