S&P500 Daily Action Areas & Price Targets 30/6/26
S&P500 Daily Action Areas & Price Targets 30/6/26
***QUOTING ES1! FOR CASH US500 EQUIVALENT LEVELS, SUBTRACT POINT DIFFERENCE***
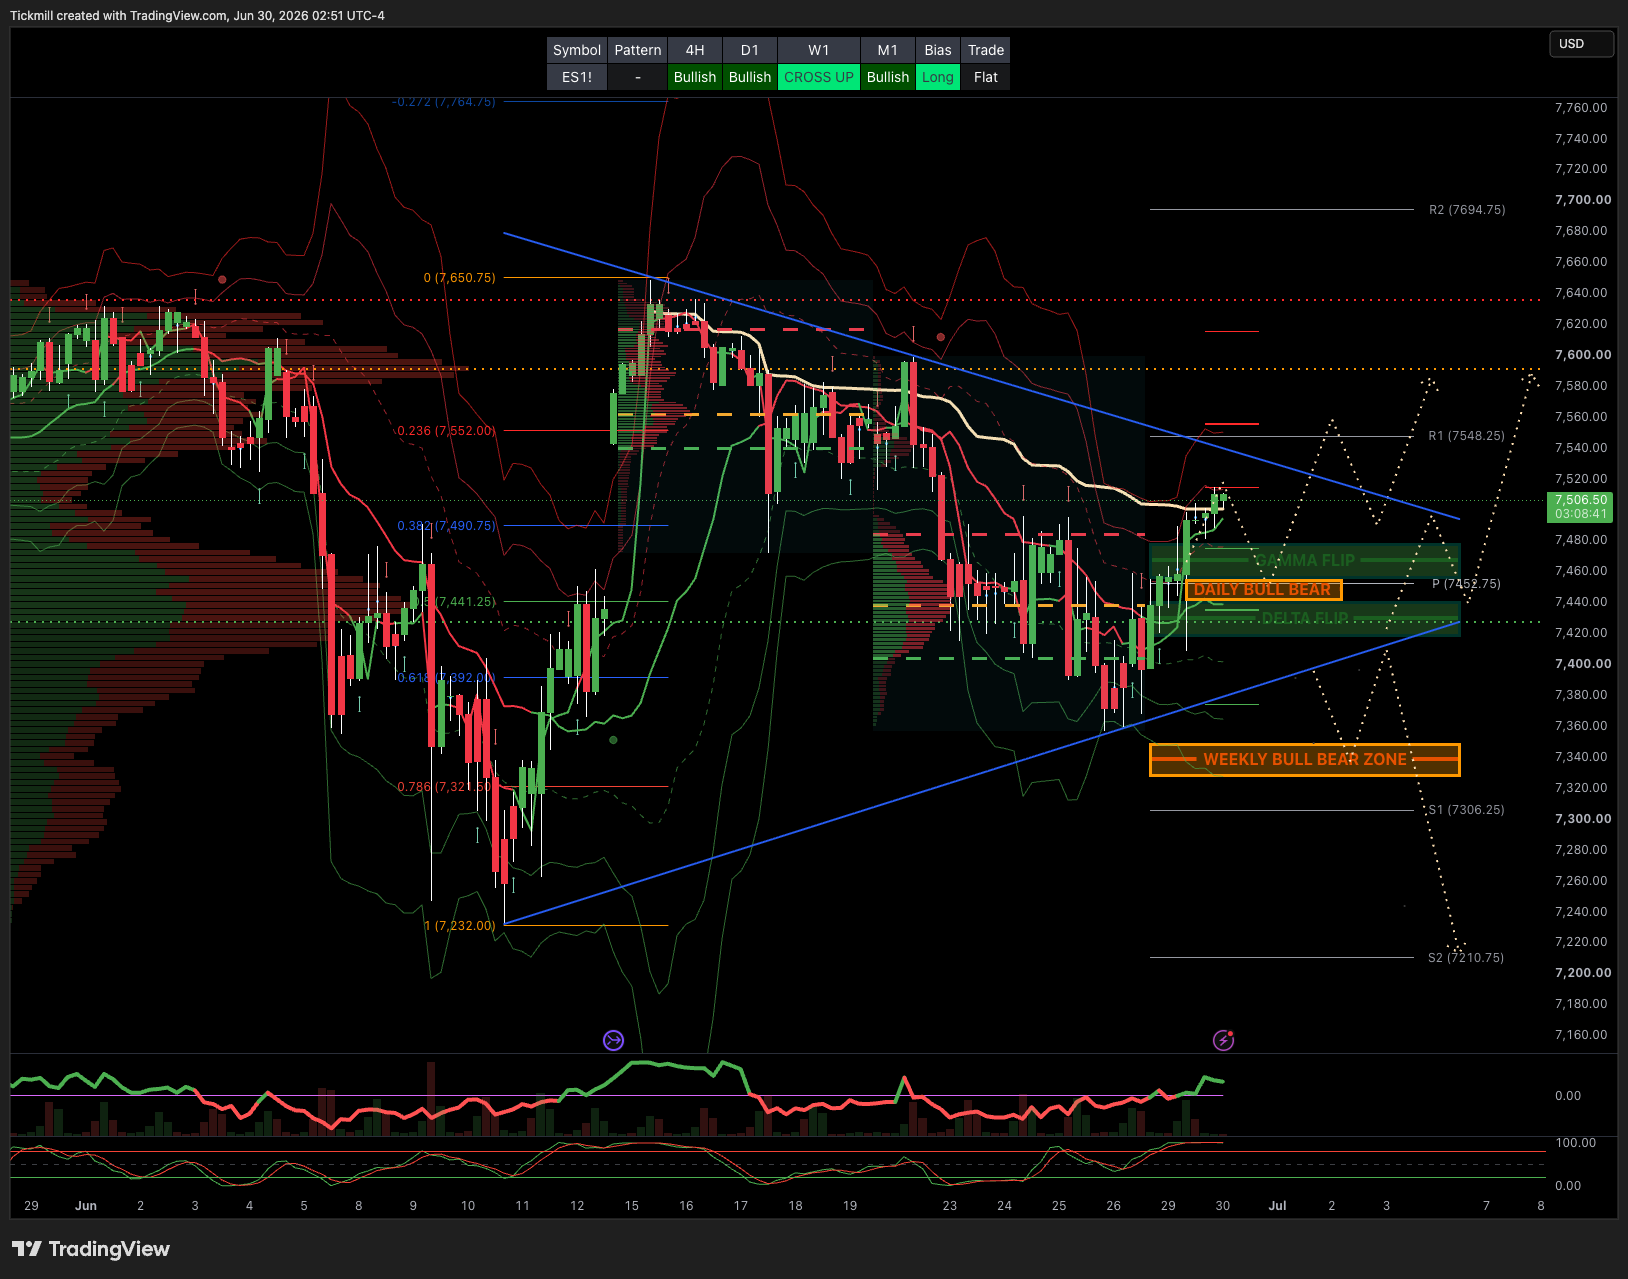
WEEKLY BULL BEAR ZONE 7350/40
WEEKLY RANGE RES 7280 SUP 7520
MONTHLY RANGE RES 7932 SUP 7384
JHEQX Q2 Collar 6189/6290 - 6865/6955
DEC2025 OPEX to DEC2026 OPEX is 945 points giving us a range of [5889,7779]
SPX PUT/CALL RATIO 1.16 (The numbers reflect options traded during the current session. A put-call ratio below 0.7 is generally considered bullish, and a put-call ratio above 1.0 is generally considered bearish.
DAILY VWAP BULLISH 7440
WEEKLY VWAP BULLISH 7494
MONTHLY VWAP BULLISH 7036
DAILY STRUCTURE - BALANCE 7505/7360
WEEKLY STRUCTURE - BALANCE 7648/7247
MONTHLY STRUCTURE - OTFH - 7199
Balance: This refers to a market condition where prices move within a defined range, reflecting uncertainty as participants await further market-generated information. Our approach to balance includes favouring fade trades at the range extremes (highs/lows) while preparing for potential breakout scenarios if the balance shifts.
One-Time Framing Higher (OTFH): This represents a market trend where each successive bar forms a higher low, signalling a strong and consistent upward movement.
One-Time Framing Lower (OTFL): This describes a market trend where each successive bar forms a lower high, indicating a pronounced and steady downward movement.
GAMMA FLIP 7467
DELTA FLIP 7430
DAILY RANGE RES 7562 SUP 7424
2 SIGMA RES 7631 SUP 7361
VIX BULL BEAR ZONE 17.4
TRADES & TARGETS
LONG ON REJECT/RECLAIM DAILY/MONTHLY BULL BEAR ZONE ***ACTIVE POSITION***
LONG ON REJECT/RECLAIM DAILY BULL BEAR ZONE TARGET WEEKLY RANGE RES
***ADDITIONAL SETUPS & TARGETS HIGHLIGHTED ON THE CHARTS***
(I FADE TESTS OF 2 SIGMA LEVELS ESPECIALLY INTO THE FINAL HOUR OF THE NY CASH SESSION AS 90% OF THE TIME WHEN TESTED THE MARKET WILL CLOSE ABOVE OR BELOW THESE LEVELS)
GOLDMAN SACHS FICC & EQUITIES TRADING DESK VIEWS
As the market transitions into a holiday- thinned trading, the immediate focus remains on month-end rebalancing technicals before attention shifts squarely to the upcoming earnings season. The macro calendar is relatively light but carries significant event risk, highlighted by Chairman Warsh’s first major international appearance at the ECB Forum in Sintra on Wednesday, followed by Thursday’s June Nonfarm Payrolls report, where expectations sit at a moderate 130k print with unemployment steady at 4.3%. Friday’s equity rebound appeared heavily driven by rebalancing flows rather than a fundamental shift in the ongoing AI spending debate, suggesting that technicals will likely dominate price action over the next few sessions.
On the macro front, the economic outlook continues to stabilize following the US-Iran agreement. The probability of a US recession over the next twelve months has been dialed back to 15% from 25%, largely reflecting the relief valve of lower oil prices. Brent is now projected to end 2026 around $80, with balanced risks between geopolitical supply disruptions and the potential for a near-term glut as barrels re-enter the market. This energy dividend is expected to boost real incomes and support a nudge higher in second-half GDP to 2%, aided by AI-driven capex and wealth effects. However, the direct economic impulse from AI remains somewhat muted due to the import-heavy nature of semiconductor capex, keeping real consumer spending growth relatively subdued at 1.5%. While falling gasoline prices should help drag near-term core CPI lower, stickier core PCE components like software and equities-related pricing complicate the Fed’s path. With Warsh actively stepping away from forward guidance, the market remains vulnerable to elevated volatility around incoming data, especially given that half the FOMC has penciled in rate hikes despite base-case expectations for a hold.
The fundamental baton now passes to second-quarter earnings, which face a high hurdle after arithmetically driving the entirety of the S&P 500’s 18% gain over the past year against a flat 20x forward multiple. Consensus expects a robust 22% year-over-year EPS growth rate for the quarter, but the internals remain historically concentrated. AI infrastructure is projected to account for roughly 60% of total Q2 EPS growth, with Micron and Nvidia alone driving over 40%, while the median stock is expected to deliver a more pedestrian 9% growth. Crucially, margins are emerging as the primary battleground. While revenue expectations appear conservative, rising input costs and supply chain pressures have flattened year-over-year margin expectations for the median stock, shifting the focus entirely toward pricing power and cost control.
The hyperscaler capex debate remains the most critical narrative for the broader market. Following a first-quarter reporting season that added over $100 billion to 2026 capex forecasts while providing early evidence of AI monetization, investors are now demanding further proof of return on investment. Microsoft’s guidance at the end of July will likely serve as the definitive tell for 2027 spending trajectories. The market is acutely focused on how much these companies will spend, where the capital will be deployed across the ecosystem, and how this burden will impact the spenders' own earnings profiles. There is a natural limit to how far these platform names can de-rate before value buyers step in, but the burden of proof has clearly shifted higher.
Positioning data underscores a distinct de-risking dynamic heading into the quarter-end. Global equities experienced their largest percentage net selling by hedge funds in three months, driven by a combination of shorting and long sales, which pushed fundamental long/short gross leverage down to a one-year low. The selling was heavily concentrated in the TMT space, with Information Technology and Communication Services enduring their largest combined net selling in over a decade. Semis, communications equipment, and software bore the brunt of the pressure across all major regions. Broader fund flows mirrored this hesitation, with global equity mutual funds seeing slight outflows after massive inflows the prior week, and technology funds leading the redemptions. Despite this aggressive tactical trimming, hedge fund gross and net allocations to TMT remain in the 96th and 94th percentiles relative to the past year, indicating that while the market is actively reducing leverage and taking chips off the table, the structural commitment to the tech and AI trade remains deeply entrenched.
Disclaimer: The material provided is for information purposes only and should not be considered as investment advice. The views, information, or opinions expressed in the text belong solely to the author, and not to the author’s employer, organization, committee or other group or individual or company.
Past performance is not indicative of future results.
High Risk Warning: CFDs are complex instruments and come with a high risk of losing money rapidly due to leverage. 71% and 74% of retail investor accounts lose money when trading CFDs with Tickmill UK Ltd and Tickmill Europe Ltd respectively. You should consider whether you understand how CFDs work and whether you can afford to take the high risk of losing your money.
Futures and Options: Trading futures and options on margin carries a high degree of risk and may result in losses exceeding your initial investment. These products are not suitable for all investors. Ensure you fully understand the risks and take appropriate care to manage your risk.
Patrick has been involved in the financial markets for well over a decade as a self-educated professional trader and money manager. Flitting between the roles of market commentator, analyst and mentor, Patrick has improved the technical skills and psychological stance of literally hundreds of traders – coaching them to become savvy market operators!