S&P500 Trading Update 24/4/26

S&P500 Trading Update 24/4/26
***QUOTING ES1! FOR CASH US500 EQUIVALENT LEVELS, SUBTRACT POINT DIFFERENCE***
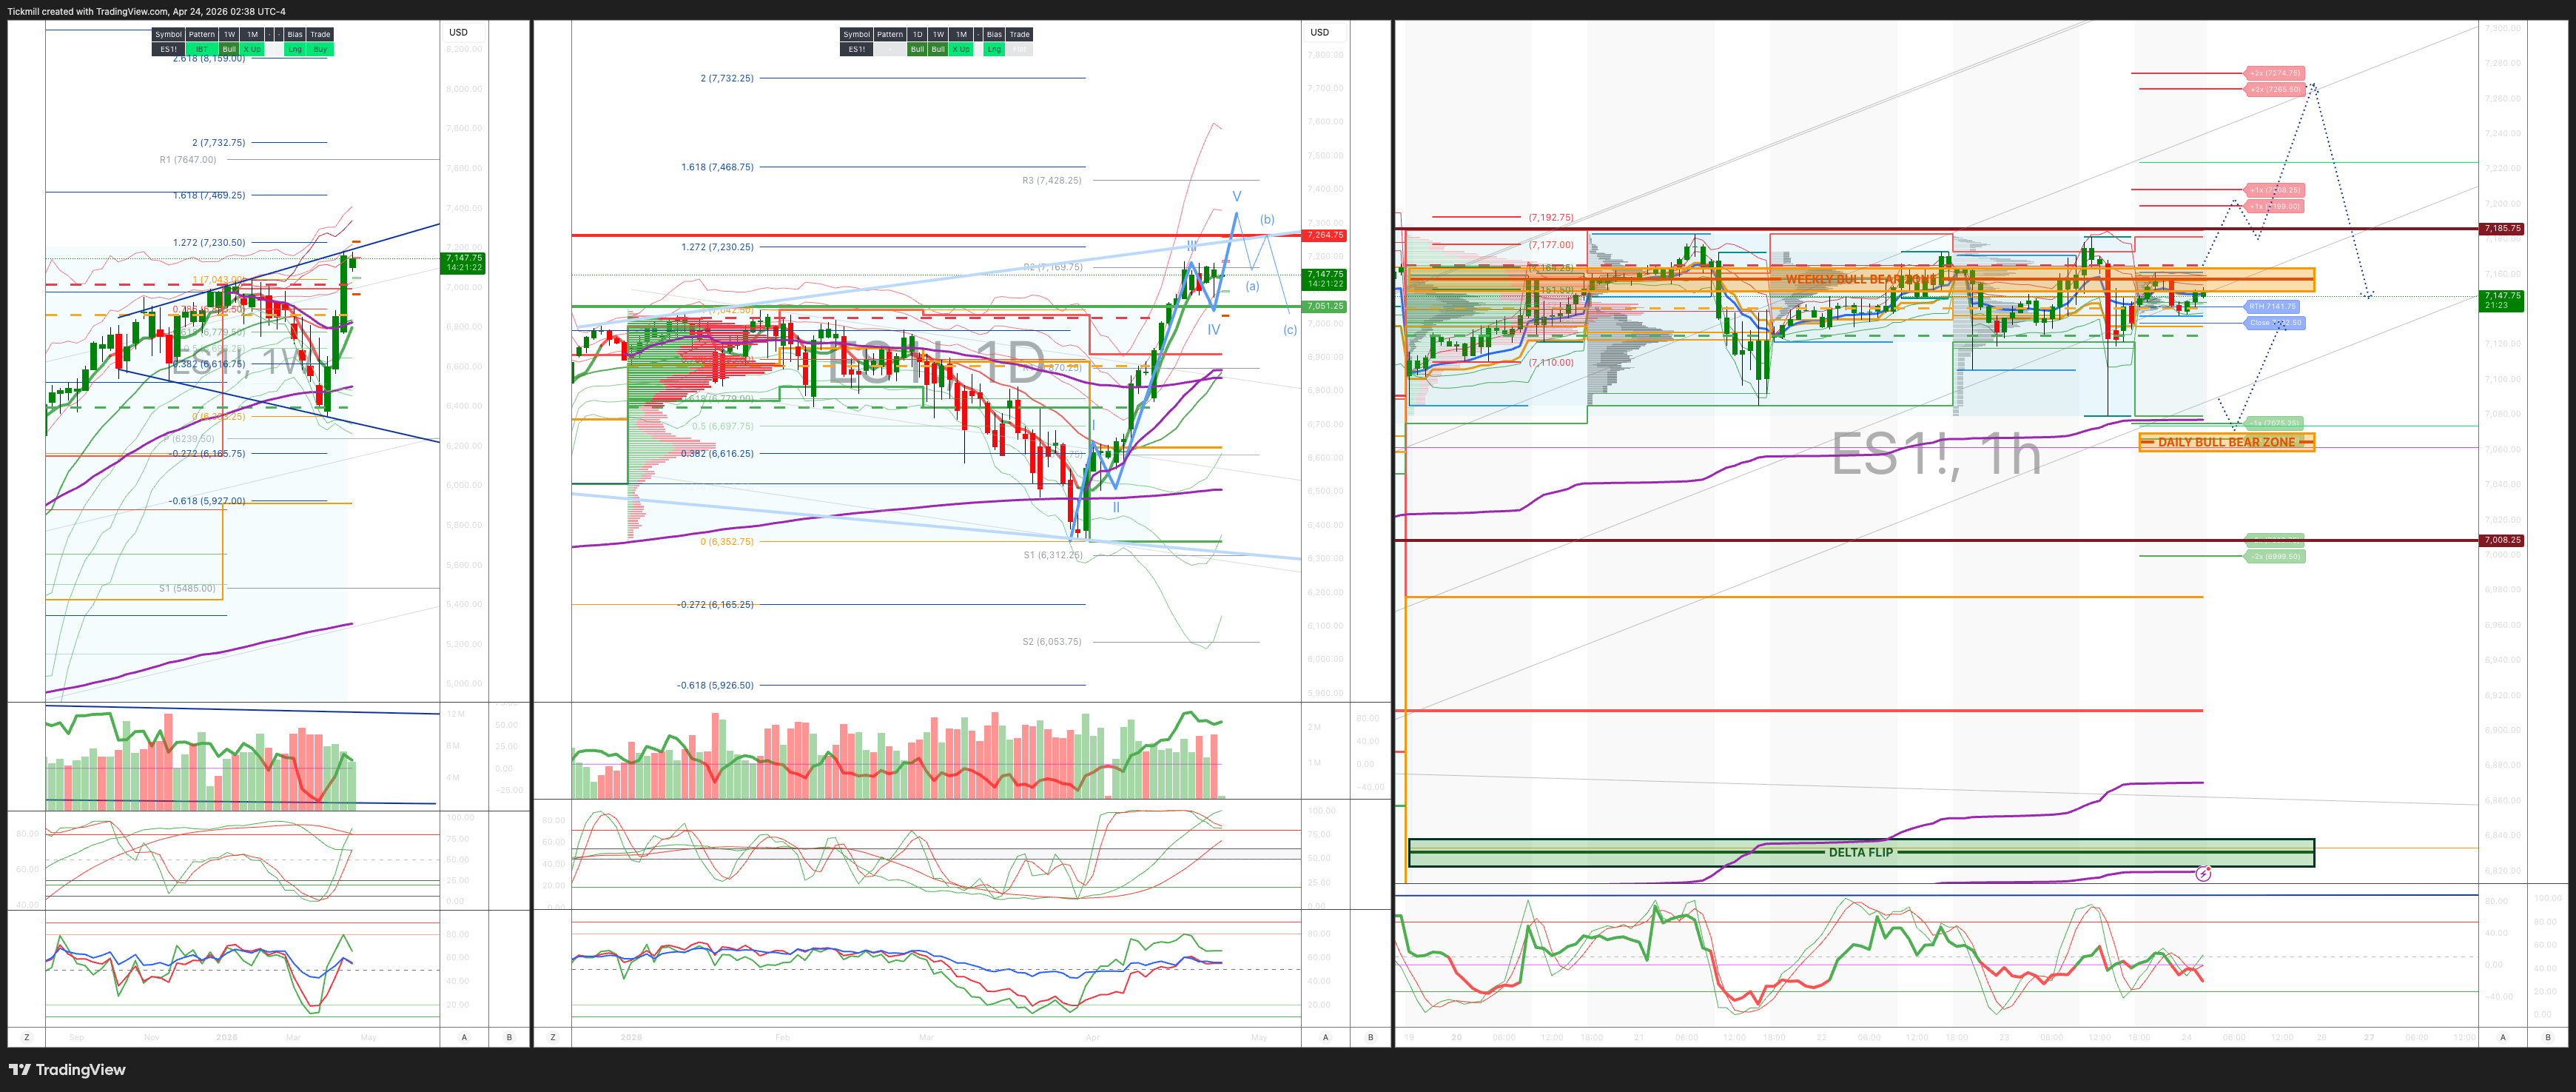
WEEKLY BULL BEAR ZONE 67150/60
WEEKLY RANGE RES 7262 SUP 7050
May OPEX Straddle: 225pt range implies a OPEX to OPEX range of [6900, 7350]
June QOPEX Straddle is 546.4pt giving us a range of [5960,7052]
JHEQX Q2 Collar 6189/6290 - 6865/6955
DEC2025 OPEX to DEC2026 OPEX is 945 points giving us a range of [5889,7779]
SPX PUT/CALL RATIO 1.28 (The numbers reflect options traded during the current session. A put-call ratio below 0.7 is generally considered bullish, and a put-call ratio above 1.0 is generally considered bearish)
DAILY VWAP BULLISH 7140
WEEKLY VWAP BULLISH 6825
MONTHLY VWAP BULLISH 6815
DAILY STRUCTURE – BALANCE - 7185/7085
WEEKLY STRUCTURE – OTFH - 6826
MONTHLY STRUCTURE - OTFD - BALANCE
Balance: This refers to a market condition where prices move within a defined range, reflecting uncertainty as participants await further market-generated information. Our approach to balance includes favouring fade trades at the range extremes (highs/lows) while preparing for potential breakout scenarios if the balance shifts.
One-Time Framing Higher (OTFH): This represents a market trend where each successive bar forms a higher low, signalling a strong and consistent upward movement.
One-Time Framing Down (OTFD): This describes a market trend where each successive bar forms a lower high, indicating a pronounced and steady downward movement.
DAILY BULL BEAR ZONE 7065/55
DELTA FLIP 6831
DAILY RANGE RES 7208 SUP 7103
2 SIGMA RES 7274 SUP 7008
VIX BULL BEAR ZONE 19.5
TRADES & TARGETS
LONG ON REJECT/RECLAIM OF DAILY BULL BEAR ZONE TARGET RTH/ETH CLOSES > DAILY RANGE RES
***ADDITIONAL SETUPS & TARGETS HIGHLIGHTED ON THE CHARTS***
(I FADE TESTS OF 2 SIGMA LEVELS ESPECIALLY INTO THE FINAL HOUR OF THE NY CASH SESSION AS 90% OF THE TIME WHEN TESTED THE MARKET WILL CLOSE ABOVE OR BELOW THESE LEVELS)
GOLDMAN SACHS TRADING DESK VIEW - ‘HEADLINE’
US equities took a modest step back on Thursday, with the major indices finishing lower as the lack of progress in US-Iran peace negotiations continued to weigh on risk sentiment and oil pushed sharply higher. The S&P 500 fell 0.41% to 7,108, with a $2.4bn MOC imbalance to sell, while the Nasdaq 100 lost 0.57%, the Russell 2000 slipped 0.37%, and the Dow declined 0.36%. Trading volumes picked up somewhat to 17.5bn shares, though still below the 19.4bn YTD average. VIX rose 2.06% to 19.31, WTI climbed 4.16% to $96.76, and the US 10-year yield edged 2bp higher to 4.32%. The late headline that Iran had deployed more mines in the Strait of Hormuz added to the uneasy tone and reinforced the market’s sensitivity to any deterioration in the geopolitical backdrop.
Under the surface, the session was less about broad panic and more about sector-level digestion and rotation. Software saw renewed pressure, with investors showing very little appetite to buy the dip after a run of recent strength. The tone carried a familiar “sell the short-term EPS datapoint, focus on the longer-term overhang” feel seen in prior earnings seasons, with ServiceNow down 17% and IBM down 8% helping sour sentiment around the group. In Healthcare, the focus was on Life Sciences Tools, where Thermo Fisher fell 9% after only guiding in line — a result that appears to have disappointed investors who had hoped management was being conservatively positioned. That weakness spread across the broader tools complex.
At the same time, rotation within Healthcare remained active. Molina surged 14% post-earnings, extending the theme of better-than-feared managed care results, while Boston Scientific rose 1% on a T+1 basis following an upgrade. That relative strength likely intensified some of the selling pressure in tools as investors recycled exposure inside the sector rather than exiting Healthcare altogether.
Desk color suggested moderate but meaningful activity. The floor rated the day a 6 out of 10 on activity, and it finished -245bp, well below its roughly flat 30-day average. Asset managers ended roughly flat overall, with supply in macro and staples offset by demand in discretionary. Hedge funds were more active, ending as roughly $1bn net sellers, driven by supply in tech, macro and communication services, partly offset by demand in Healthcare. One notable macro flow point is the latest pension rebalance model, which now implies roughly $25bn of US equity selling. That ranks among the 15 largest sell estimates since 2000, and excluding quarterly expiry effects, it would represent the largest monthly sell estimate on record.
In derivatives, the desk focus remained on the market’s headline sensitivity and reflexive rebounds after negative news. For much of the day, the pattern was the familiar spot down / vol up dynamic, but what stood out was that vol was sold aggressively into the close, leaving it only modestly higher by end of day. That likely suggests dealers still own downside protection, which helps limit how disorderly index weakness becomes in the near term. Flows featured short-dated index and ETF hedging, while the straddle for the rest of the week widened to around 68bp. Despite the day’s pullback, the desk still prefers upside exposure in tech and financials heading into next week’s earnings.
Post-bell, there were some more constructive single-name prints. Intel jumped 12% and made a new all-time high, helped by Q2 revenue guidance well above both Street and buyside expectations. Edwards Lifesciences rose 2% after a beat in TAVR and TMTT and a raised guide.
Disclaimer: The material provided is for information purposes only and should not be considered as investment advice. The views, information, or opinions expressed in the text belong solely to the author, and not to the author’s employer, organization, committee or other group or individual or company.
Past performance is not indicative of future results.
High Risk Warning: CFDs are complex instruments and come with a high risk of losing money rapidly due to leverage. 69% and 73% of retail investor accounts lose money when trading CFDs with Tickmill UK Ltd and Tickmill Europe Ltd respectively. You should consider whether you understand how CFDs work and whether you can afford to take the high risk of losing your money.
Futures and Options: Trading futures and options on margin carries a high degree of risk and may result in losses exceeding your initial investment. These products are not suitable for all investors. Ensure you fully understand the risks and take appropriate care to manage your risk.
Patrick has been involved in the financial markets for well over a decade as a self-educated professional trader and money manager. Flitting between the roles of market commentator, analyst and mentor, Patrick has improved the technical skills and psychological stance of literally hundreds of traders – coaching them to become savvy market operators!